Period change percentages for finance reports
xpenser added period change percentages so dashboards and reports can show how income and expenses moved versus prior periods.
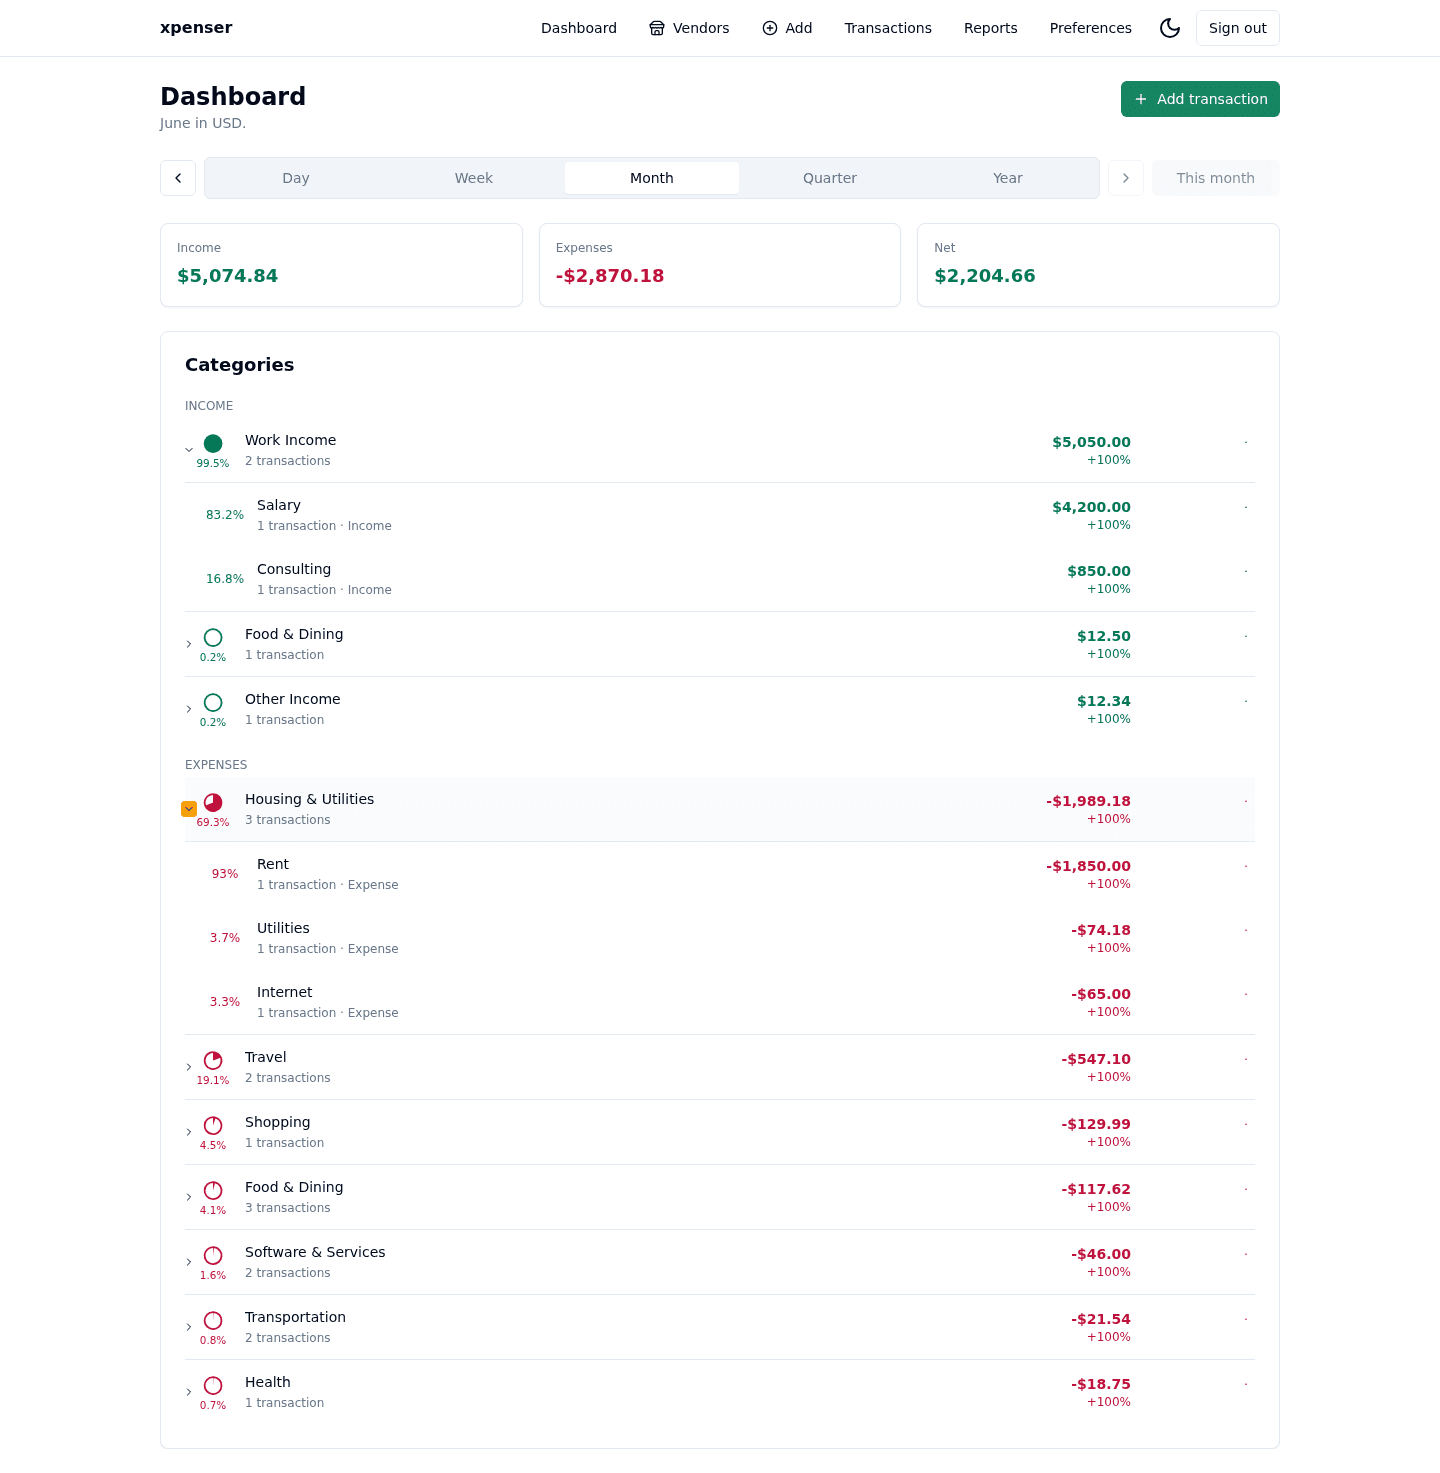
Reports gained percentage change context for comparing one period against another.
This release came from PR #42 and is now part of the xpenser release archive. It gives people evaluating an open-source expense tracker a clearer view of how the product has improved over time.
What changed
- Added percent-change behavior for period comparisons.
- Applied comparison context to finance summaries.
- Kept the display focused on understandable movement, not only raw totals.
Why it matters
A dollar change and a percentage change answer different questions. Percentages help users see whether movement is meaningful relative to the previous period.
Where it fits
This makes xpenser dashboard and report review more analytical.
For a broader product overview, start with the xpenser home page. Developers can also explore the personal finance API and MCP tools, while self-hosters can review the self-hosted personal finance tracker page.