Nested report breakdowns for finance analysis
xpenser added nested report breakdowns so category hierarchy can be used for richer income and expense analysis.
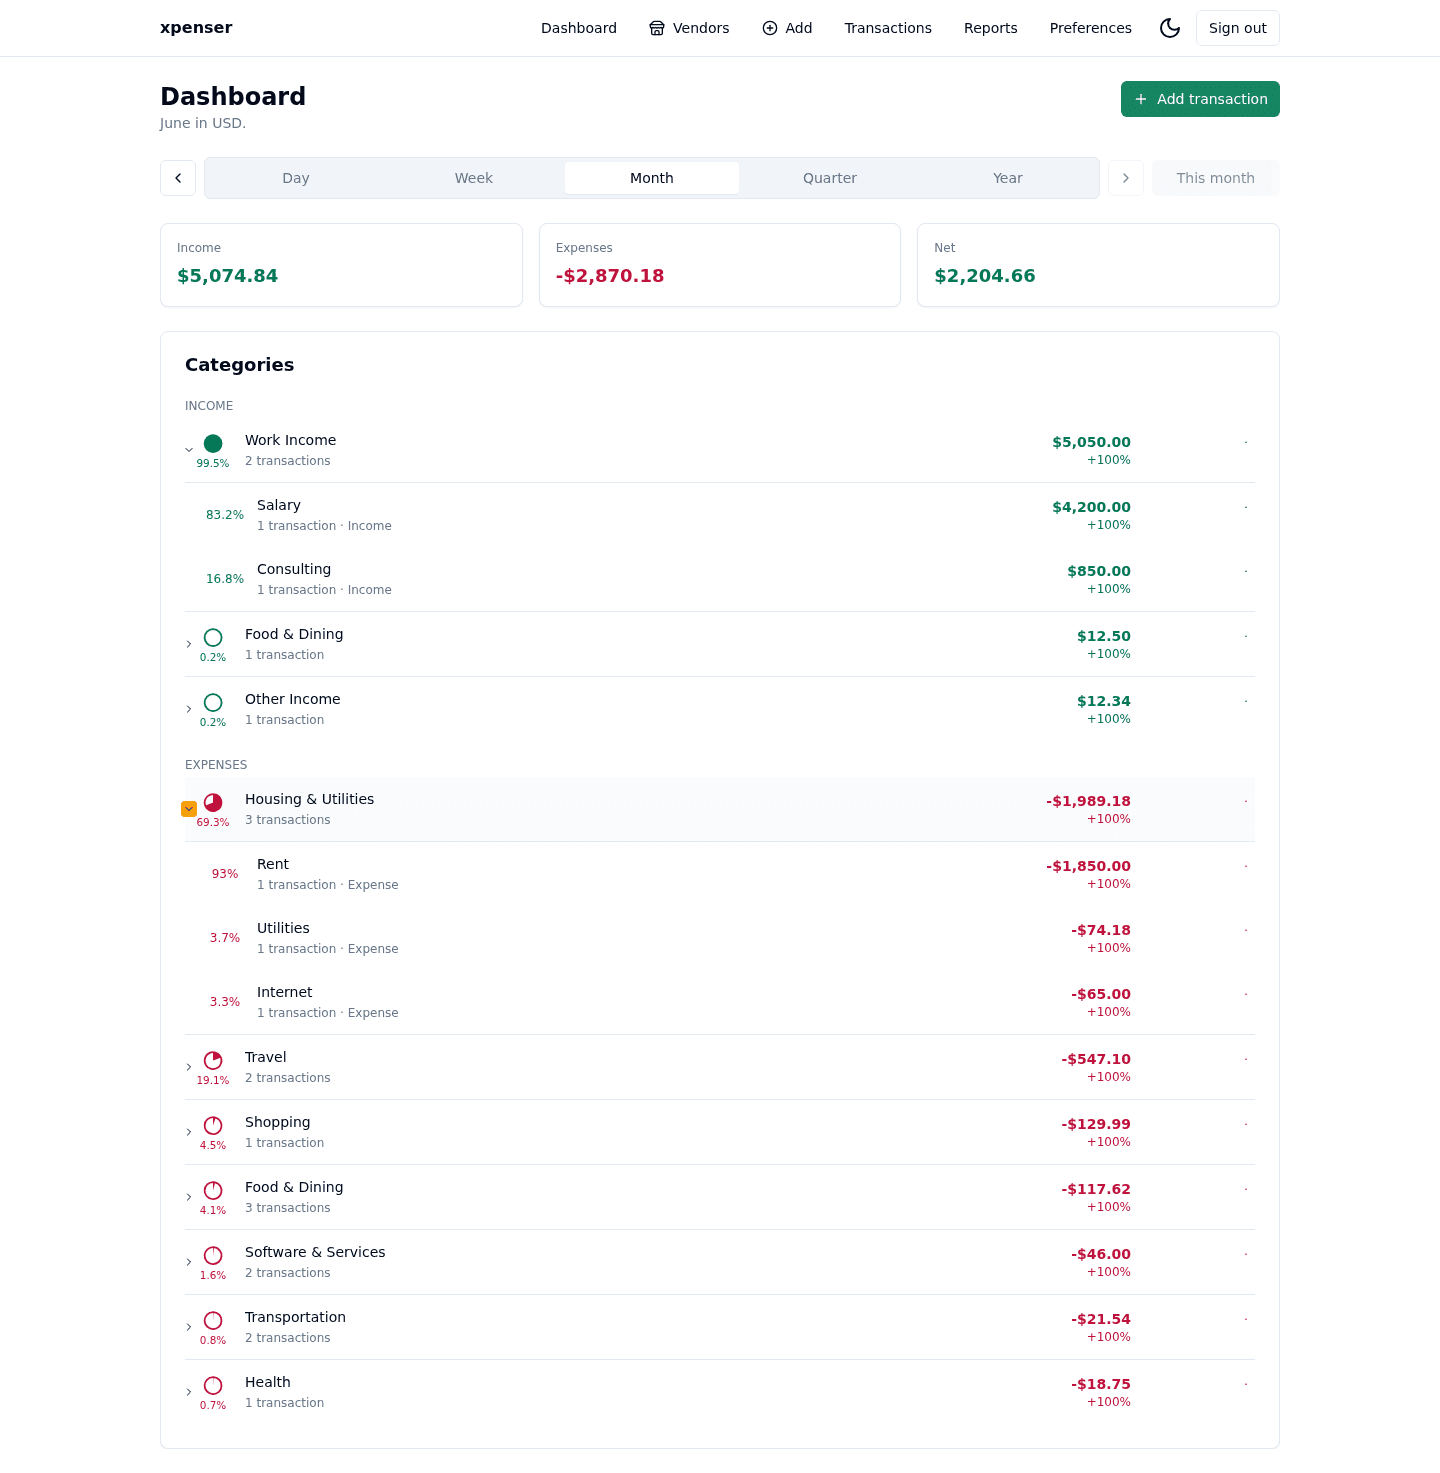
Reports learned to present nested breakdowns that match hierarchical finance categories.
This release came from PR #44 and is now part of the xpenser release archive. It gives people evaluating an open-source expense tracker a clearer view of how the product has improved over time.
What changed
- Added nested breakdown behavior to reporting views.
- Connected hierarchy data to report analysis.
- Improved scanability for grouped income and expense categories.
Why it matters
Nested reports help users see both high-level category groups and the details underneath without losing context.
Where it fits
This builds on category hierarchy and makes xpenser reports more useful for real spending analysis.
For a broader product overview, start with the xpenser home page. Developers can also explore the personal finance API and MCP tools, while self-hosters can review the self-hosted personal finance tracker page.