Category trend charts for expense reports
xpenser added category trend reports with configurable timeframes, bucket density guards, category switching, and transaction drilldowns.
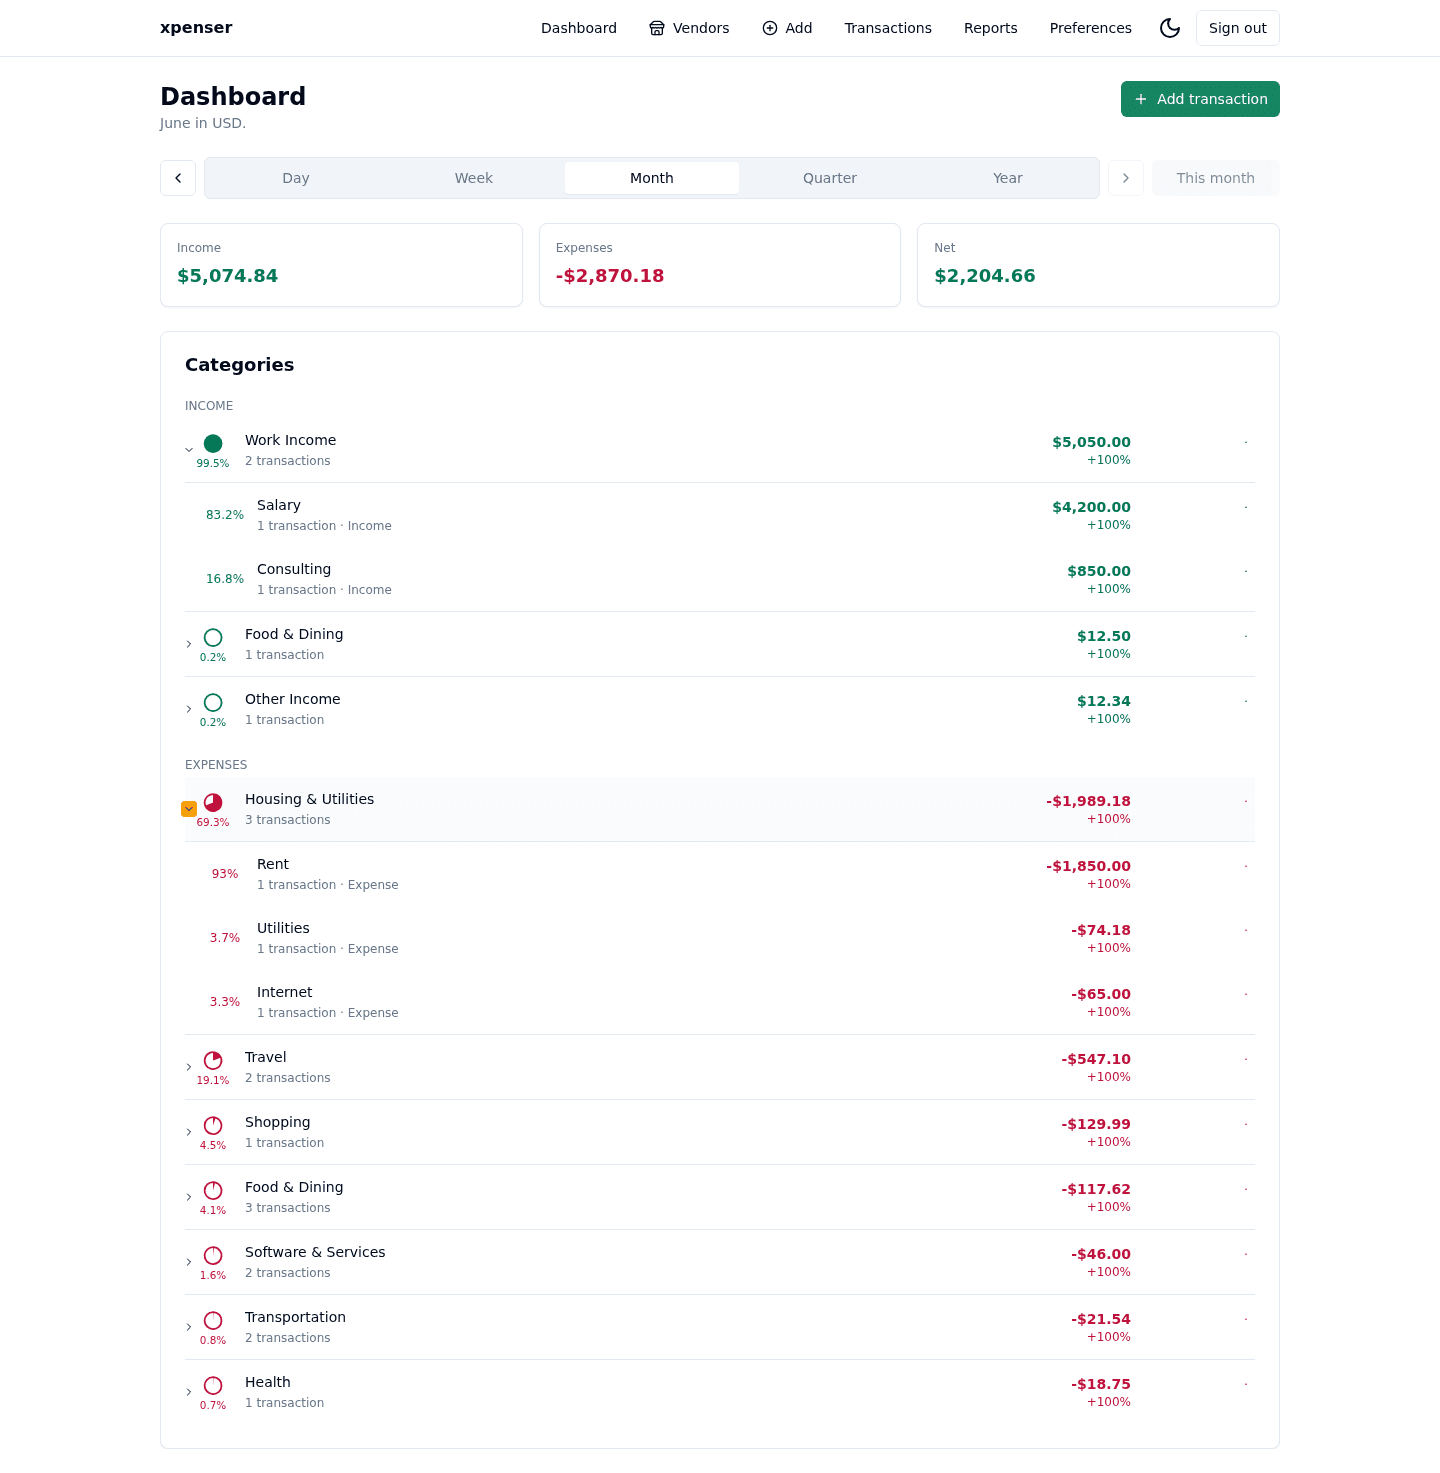
Reports now make category movement visible over time instead of only showing static period totals.
This release came from PR #14 and is now part of the xpenser release archive. It gives people evaluating an open-source expense tracker a clearer view of how the product has improved over time.
What changed
- Added a typed category trend stats endpoint.
- Built a reports drilldown page with category switching and custom ranges.
- Linked trend buckets back to matching transactions.
Why it matters
Trends reveal whether spending behavior is changing. Drilldowns keep the chart explainable by connecting every bucket to real transactions.
Where it fits
This release moves xpenser toward deeper personal finance analytics while preserving traceability.
For a broader product overview, start with the xpenser home page. Developers can also explore the personal finance API and MCP tools, while self-hosters can review the self-hosted personal finance tracker page.